
Probe API field reference
Enabling the probe
Section titled “Enabling the probe”The probe is enabled in “System Settings → Probe”: disguise the site as a public monitor page, configure title, logo, hidden login, which servers are shown and which metrics (CPU / memory / disk / ping) Agents collect. Region, provider and renewal price shown per server are entered in “Servers → Edit server → Probe display info”.
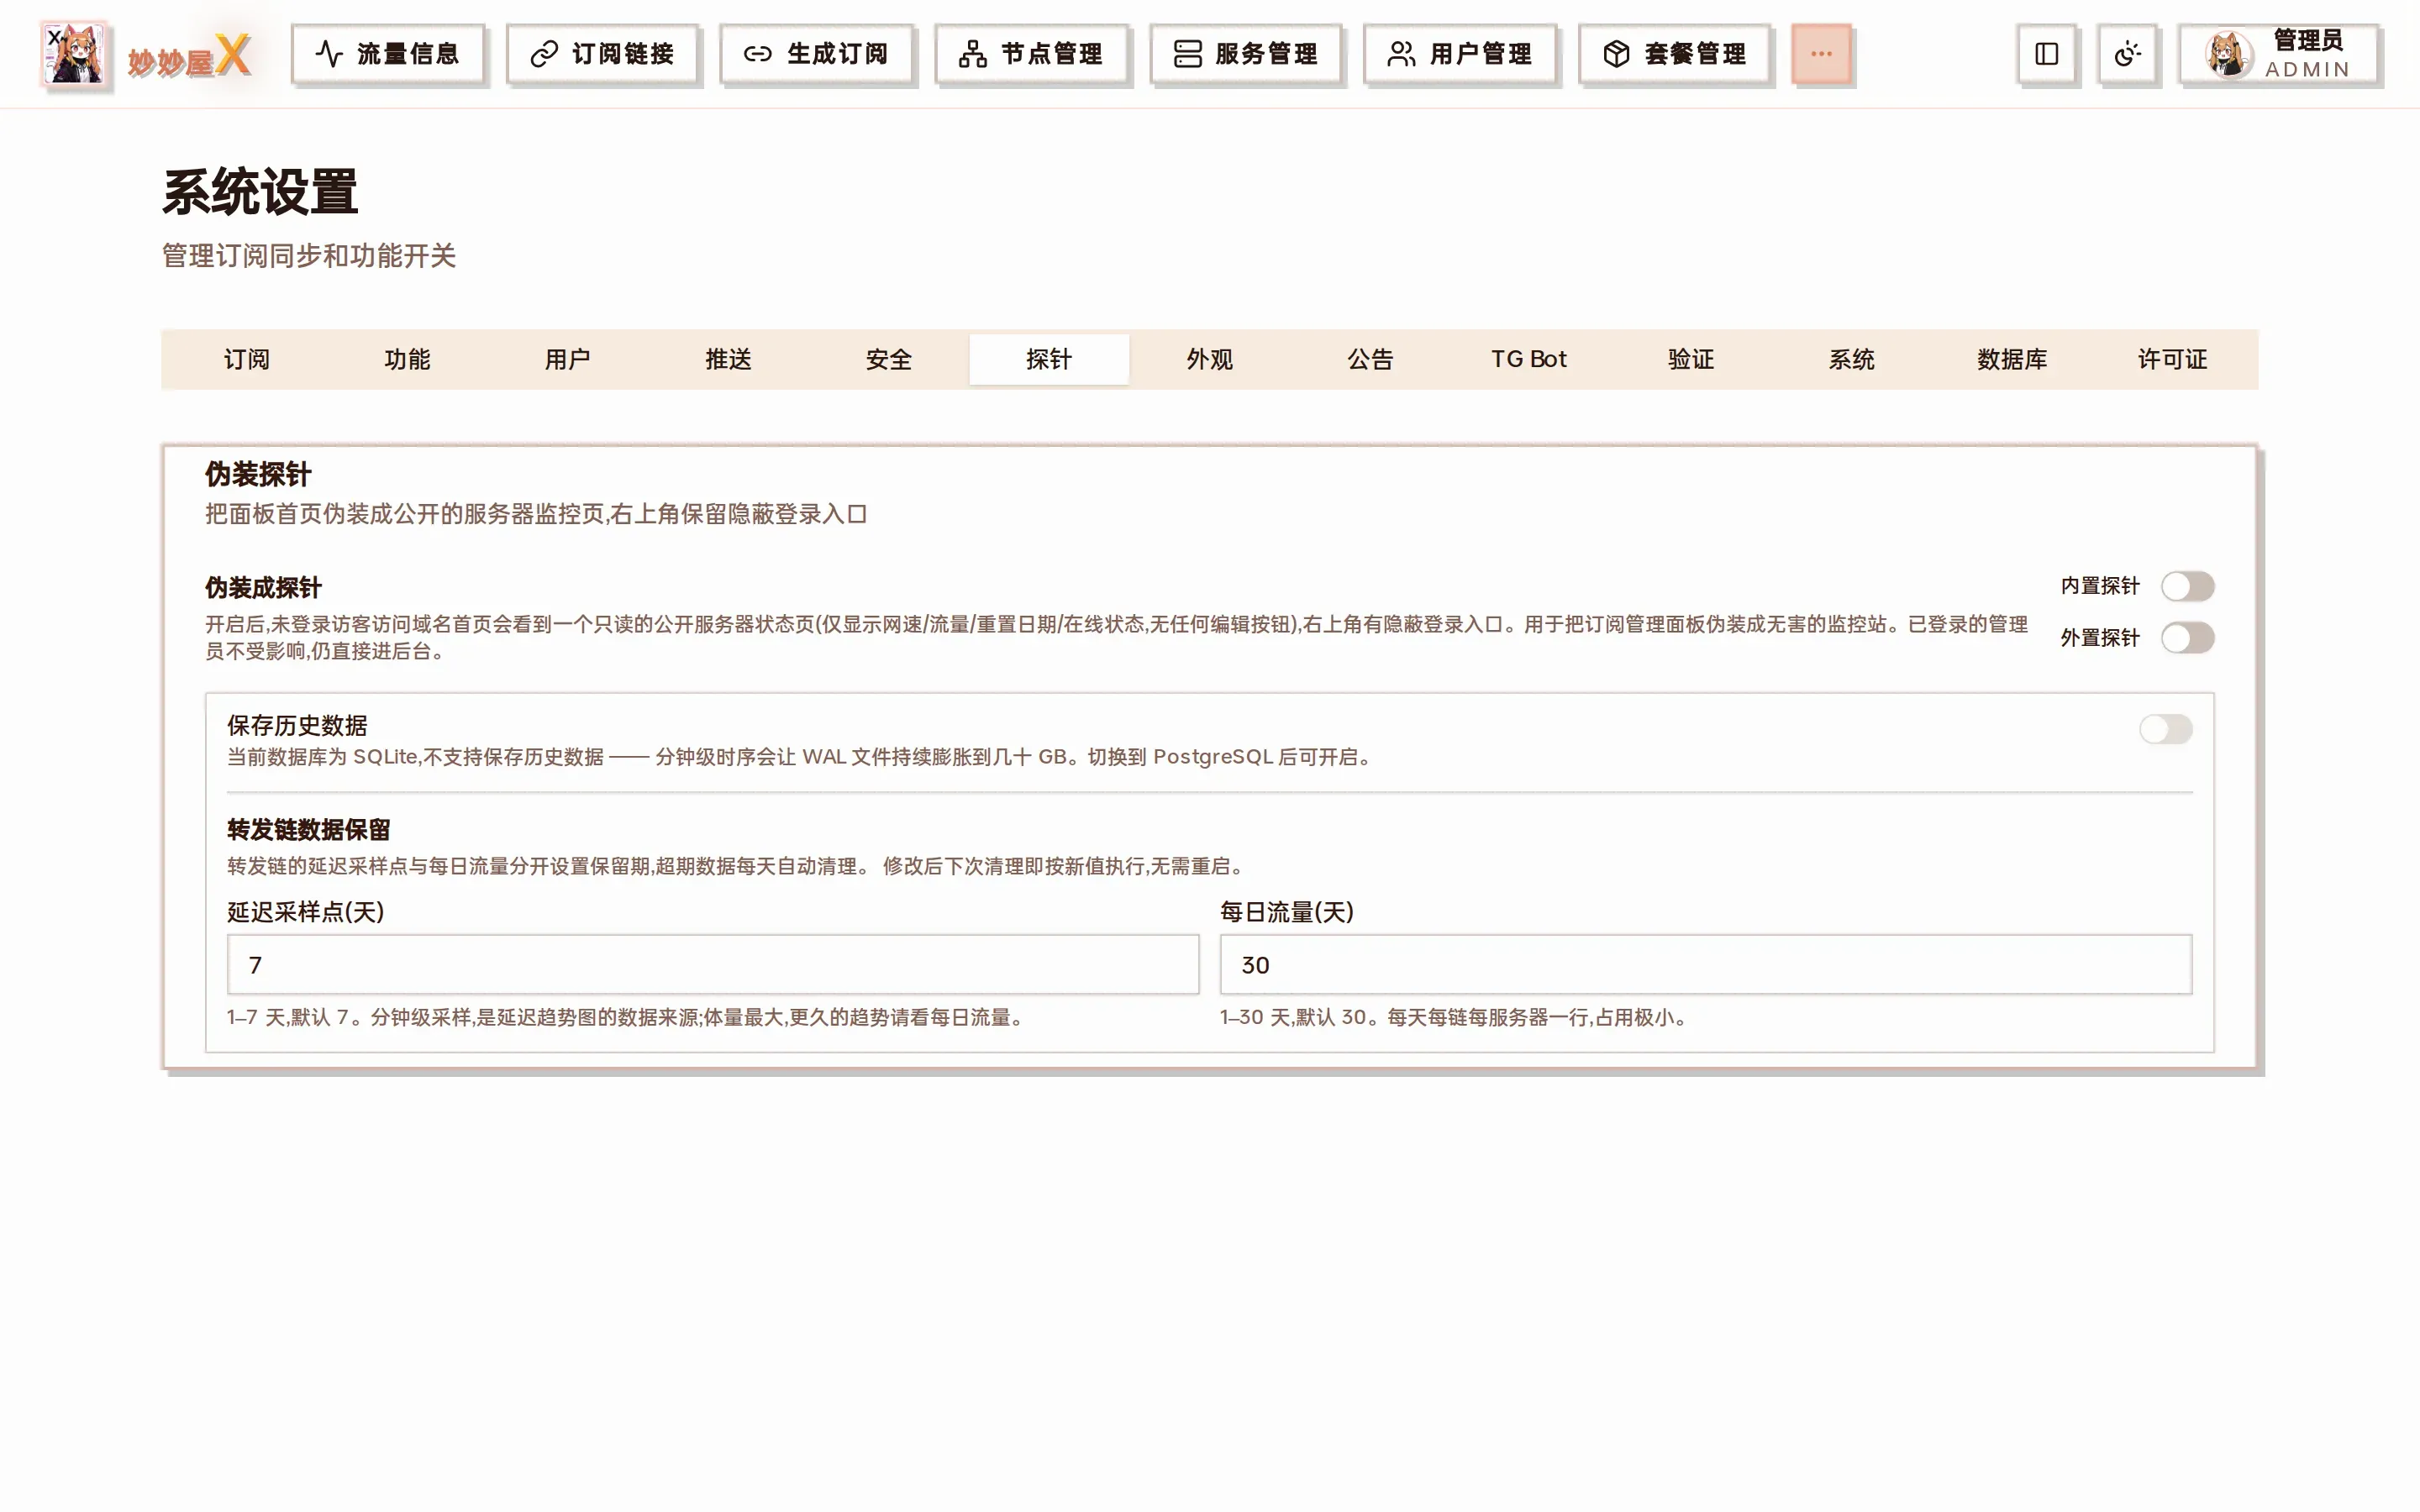
System Settings → Probe: disguised probe switches
Access and authentication
Section titled “Access and authentication”The built-in probe uses same-origin browser requests. A protected standalone probe must send X-MMwx-Probe-Token. Disabled probe channels normally return 404.
| GET /api/public/probe-servers | Current state and one-hour latency summary |
| WS /api/public/probe-ws | Pushes the same snapshot every five seconds |
| GET /api/public/probe-series | Latency or system metric history |
Snapshot fields
Section titled “Snapshot fields”| Field | Type / unit | Description |
|---|---|---|
| enabled | boolean | Whether probe data is enabled; the only guaranteed field when disabled |
| title | string | Custom probe title |
| logo | string | Logo URL or data URI |
| appearance | object | Theme metadata: theme, color_mode, and revision |
| block_login | boolean | Whether the original login page is blocked |
| show_name | boolean | Whether server names are included |
| show_globe | boolean | Whether the 3D globe is displayed |
| license_badge | object | Optional badge with name and display_name |
| servers | array | Servers selected by the administrator |
servers[] fields
Section titled “servers[] fields”| Field | Type / unit | Description |
|---|---|---|
| name | string | Server name, controlled by the show-name switch |
| online | boolean | Online according to Agent WebSocket or stored status |
| region | string | Region emoji |
| region_country / region_name / region_city | string | Country, full region, and city |
| provider_name / provider_url | string | Provider name and validated HTTP(S) URL |
| telecom_paid_peer | boolean | Provider is marked as Telecom 163 Paid Peer |
| upload_speed / download_speed | integer, B/s | Current system-NIC rates; independent of traffic_source/mode |
| traffic_used / traffic_limit | integer, byte | Server billing counter and limit; zero means unlimited |
| traffic_source / traffic_stats_mode | string | xray/system and both/upload/download/max |
| traffic_used_scope | string | configured_period for a valid cycle; counter_since_reset without a calendar cycle |
| traffic_used_up / traffic_used_down / traffic_used_total | integer, byte | Raw current-cycle directions and sum when a valid reset day exists |
| traffic_adjustment | integer, byte | Cycle reconciliation when valid; only the server offset without a cycle; may be negative |
| period_start / period_end | YYYY-MM-DD | Inclusive start and exclusive next reset; omitted without a valid reset day |
| boot_traffic_up / boot_traffic_down / boot_traffic_scope | integer / string | Raw Agent NIC totals for the current boot; scope is current_boot |
| cumulative_up / cumulative_down | integer, byte | Legacy aliases for boot_traffic, not current-cycle totals |
| cumulative_traffic_scope | string | Explicit scope for the compatibility fields; currently current_boot |
| daily_traffic | array | Raw daily directions selected by the server traffic source |
| daily_traffic_scope / daily_traffic_start / daily_traffic_end | string / date | Returned window and inclusive boundary dates, including zero-filled days |
| cpu_pct | number, % | CPU utilization |
| loadavg | string | System load text |
| mem_used / mem_total | integer, byte | Used and total memory |
| disk_used / disk_total | integer, byte | Used and total disk space |
| uptime | integer, second | System uptime |
| cpu_model / cpu_cores / cpu_threads | string / integer | CPU model, cores, and threads |
| os / kernel / arch | string | Operating system, kernel, and architecture |
| ping | array | One-hour latency and packet-loss summary |
| expires_at | YYYY-MM-DD | Expiry date; may fall back to the next traffic reset |
| renewal_price / renewal_currency | number / string | Original renewal price and ISO currency |
| renewal_cycle | string | month, quarter, half_year, or year |
| renewal_price_cny | number | CNY conversion using license-server rates |
| return_routes | array | Three-carrier return-route results |
Nested structures
Section titled “Nested structures”daily_traffic[]: date (YYYY-MM-DD), uplink, downlink, total (byte). Directions do not apply traffic_stats_mode or traffic_adjustment. daily_traffic_scope is recent_7d or configured_period_and_recent_7d; the latter covers the complete current cycle and at least the latest seven days. Missing dates are zero-filled, so start/end describe the returned window rather than the first or last real sample.
With a valid reset cycle, the API guarantees:
traffic_used = apply(traffic_stats_mode, traffic_used_up, traffic_used_down) + traffic_adjustmentWithout a valid reset day, cycle directions and period_* are omitted so the latest seven days are never mislabeled as a billing cycle. See Traffic accounting for UI semantics.
ping[]: key, label, isp, current_ms, loss_pct, buckets. The list contains twelve five-minute buckets. ms is average latency, loss is 0–100, and -1 means no data.
return_routes[]: carrier (telecom/unicom/mobile), region, route_type, tested_at (RFC 3339).
History series
Section titled “History series”Parameters: server is the servers array index (not a database ID); metric is ping (default) or system; range is 1h, 6h, or 24h; target is a ping key; all=1 returns all targets.
Granularity: 1h = 12×5 minutes, 6h = 36×10 minutes, and 24h = 48×30 minutes. Common fields are success, bucket_sec, generated_at, and series; all=1 adds all_series.
metric=system: cpu_pct, mem_used, mem_total, upload_speed, download_speed, cumulative_up, cumulative_down. Each value is an array of { t: Unix seconds, value: number }. The cumulative_* series is also sampled NIC traffic for the current boot.
Optional fields
Section titled “Optional fields”Most collected metrics are optional. A disabled switch, an older Agent, or missing samples causes the field to be omitted instead of returning zero. Server IDs, IPs, tokens, Agent addresses, hostnames, and Xray configuration are never exposed.